


Weather Related Charts and Graphs
NOAAs National Weather Service Heat Index Chart
Heat Index (Apparent Temperature) - A measure of human discomfort due to the combination of heat and humidity. It is a more accurate measure than air temperature alone for estimating the risk of heat and its effects on human physiology. Exposure to full sunshine can increase the heat index by 15 degrees.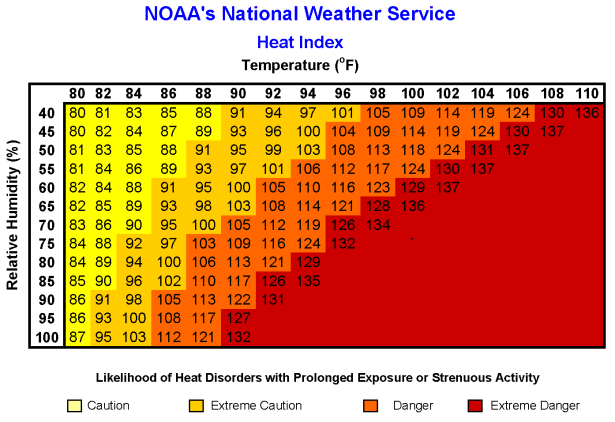
NWS Heat Index Values
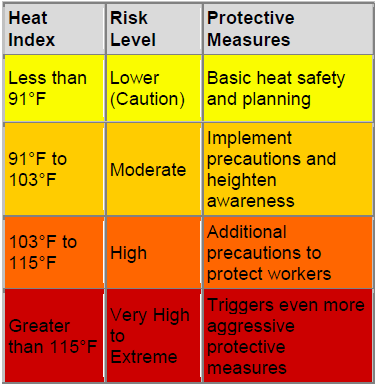
OSHA has divided heat index values into four bands associated with four risk levels. These colored bands differ slightly from those appearing in the NOAA Heat Index chart, which was developed for the public. The NOAA bands have been modified for use at worksites.
NOAAs National Weather Service Windchill Chart

* Is based on a human face model
* Incorporates heat transfer theory, heat loss from the body to its surroundings, during cold and breezy/windy days
* Lowers the calm wind threshold to 3 mph
* Uses a consistent standard for skin tissue resistance
* Assumes no impact from the sun (i.e., clear night sky).